July 12, 2018
2018 has been a bit of a grind. Through June 30th, the S&P 500 is up less than 2%. The global stock index is up less than 1%. The fixed income benchmark is down 1.5% year to date. Our clients’ portfolios have been much more productive. The stock component of our portfolios is up around 5% so far this year, and the fixed income holdings are up about 4%.
Globally, stocks are up more than 30% over the last two years. This has been a more productive period than usual, but not inordinately so. Strong earnings growth is supporting the appreciation in global companies.
Stocks reached an all-time high in late January. Since then, they have been trading in a narrow range. There are two primary drivers to stock prices – earnings and investor optimism. The S&P 500 represents approximately 80% of the total U.S. stock market. The 2018 earnings estimate for the S&P 500 is $161. This is 48% higher than the earnings results from 2016, but stocks are only 30% higher over the last two years.
Since 2016, investor confidence has moved in the opposite direction of earnings growth. Investors have a wide variety of concerns:
1) The current growth cycle is one of the longest on record.
2) The Federal Reserve is signaling that it will gradually raise interest rates.
3) Foreign trade policy is less predictable.
These concerns are all legitimate, but we should be careful not to overstate the fundamental impact on the economy.
Are we due for a recession?
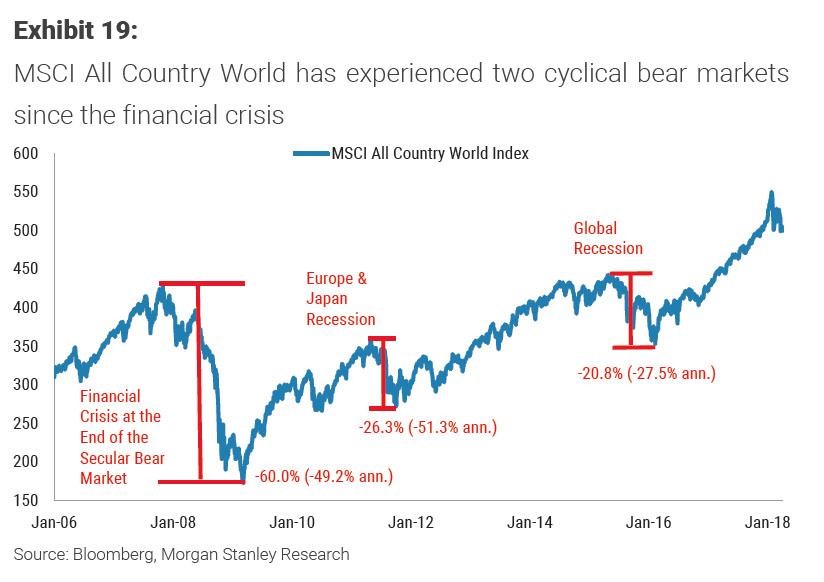
The assumption that a recession is imminent is based on the belief that the periods of economic growth typically last between five and seven years, while this one is almost nine years old. Still, every cycle is different. The economic context in which a cycle exists determines in large part how long the cycle will persist. While it’s true that this is one of the longest periods of economic growth, the rate of growth has been much slower than average expansions. As I’ve said in my last few letters, there is still no indication that this expansion will end anytime soon. The slow rate of growth is preventing the sort of excesses that coincide with major boom periods.
If we look only at the stock market, we can make the argument that 2015-16 was a period of economic weakness. Earnings dropped substantially, and the S&P 500 dropped 19%, which is only 1% away from the technical definition of a bear market. The average drop for individual stocks over this period was 27%. If we date the current bull market to early 2016, then this is a very young bull market.
Arguing over the current age of the bull market is pointless as it assumes that bull markets and economic booms follow a pre-destined schedule. There is no statistical evidence to indicate that this is the case. The farther into the future we attempt to forecast, the less useful the forecasts. Economic forecasts beyond 2019 are essentially worthless. Forecasts beyond the next six months are highly fallible. The best we can do is evaluate the current conditions to see if the current environment is likely to produce a recession. For the next six months, it appears that a recession is highly unlikely.
The best guide to predict future multi-year returns is history. Historically, stocks have returned about 10% a year. Our planning assumption is that stocks will earn at least 9% a year for the foreseeable future. The prediction in which we have the most confidence is that short-term stock prices will move randomly.
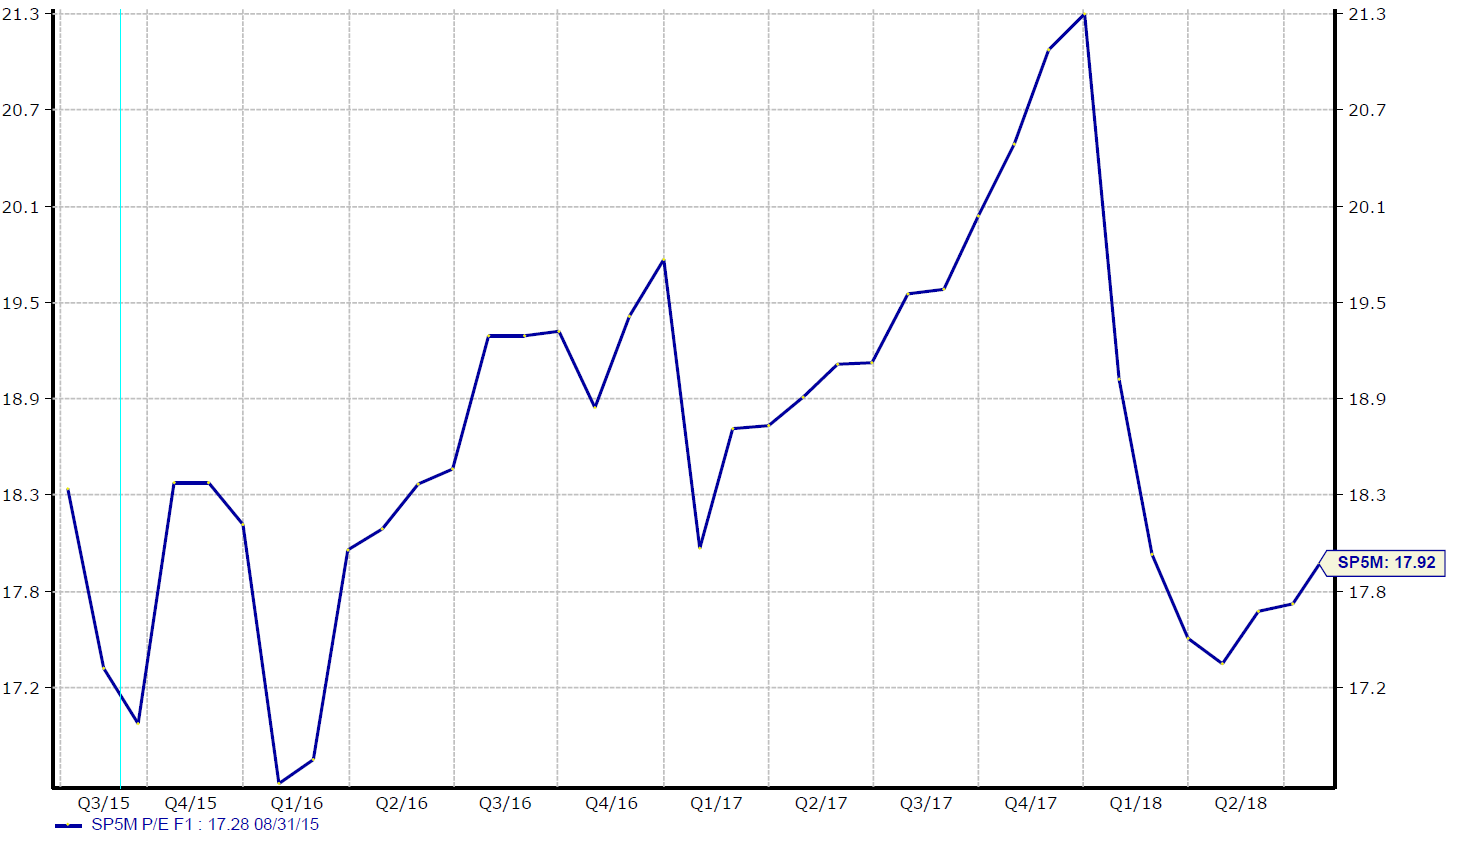
Since early January, the market is going through a kind of correction. Stock prices are flat for the year, although earnings are substantially higher. Investors are correcting the valuation that they are willing to apply to current earnings. Based on 2019 earnings estimates, stock valuations have not been this low since early 2016, following the 2015-16 bear market.
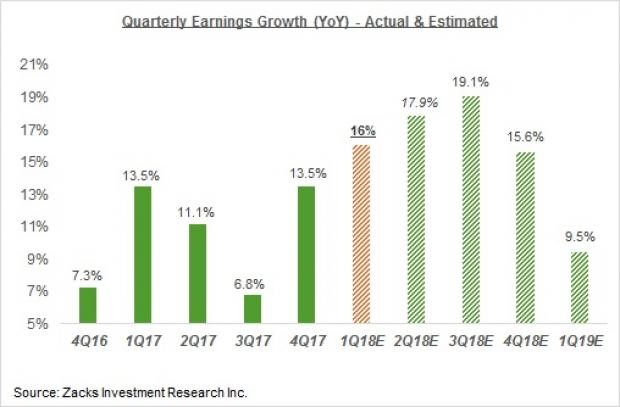
Earnings are the ultimate driver of stock prices. With earnings up almost 50% over the last two years, and the stock market only up 30%, it seems that stocks should substantially increase in value. My best guess is that as earnings growth continues to materialize over the next few quarters, investor confidence will return, driving stock prices higher. The chart below shows the last six quarters worth of earnings growth, and the forecast through the early part of next year. If actual results meet current expectations, I would expect stocks to go move 10-20% higher.
S&P earnings-based valuation is at its lowest since the bottom of the 2016 bear market
Rising Interest Rates
The Federal Reserve continues to normalize interest rate policy by gradually increasing short-term rates. For the first time since the credit crisis of 2009, money markets are paying a rate that is comparable to inflation – 2%. This is a substantial increase from the quarter percent rate of a few years ago. Besides the short-term interest rate, which is heavily influenced by Federal Reserve policy, interest rates have stayed steady. The rate for medium-term corporate debt is still under 4%.
Investors assume that short-term rates will creep up another 1% by the end of next year. The mistaken assumption is that rates will move higher for all fixed income securities, but the last year demonstrates that this is not always the case. My view is that short-term rates are moving higher as the Federal Reserve moves away from the extraordinary policy following the credit crisis.
Interest rate movements that impact our portfolios will primarily depend on the direction of the economy. If we move into a slowdown phase, our fixed income portfolio will perform well. If the next recession is a few years away, stocks should easily outperform fixed income.
Trade Policy Uncertainty
A long time ago, I earned a degree in economics at the University of Texas. Macroeconomics 101 spends a lot of time on the concept of comparative advantage. The theory of comparative advantage shows that trade is a win-win for both parties. It is better for the U.S. to import shoes from China while freeing up our labor resources to produce more lucrative products like software. This is the cornerstone belief of free-trade advocates.
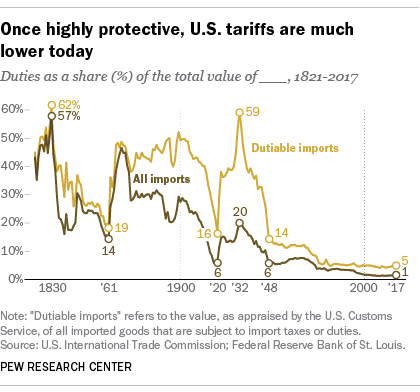
Protectionism is the opposing theory. Protectionism uses tariffs and other taxes to make imports more expensive. This was the dominant trade policy in the 1800s and briefly in the early 1930s. The current administration is slowly edging into protectionist policies. Many investors are expressing great concern about the increased protectionist tendencies of U.S. trade policy. Given the historic record of protectionist policies, this is understandable.
The U.S. economy is radically different from the economy of the 19th century. Today, 80% of our economic output comes in the form of services, like health care and financial management. Trade policy has a negligible impact on the service sectors of the economy.
The specific trade action with China involves the imposition of a 25% tax on about $34 billion worth of Chinese-made goods. This tax amounts to $8.5 billion. It’s not nothing, but it’s not significant relative to a $20 trillion economy (four one-hundredths of one percent). Some export-oriented industries will bear the brunt of the counter-attack. Soybean farmers are vulnerable, since soybeans are the largest U.S. export to China, but the overall trajectory of the economy will not turn because of the current modest increase in protectionism.
I don’t think the bull market is at risk, but the three primary concerns are unlikely to dissipate any time soon. The market needs to find a valuation floor. Sixteen times forward earnings seems like a conservative valuation assumption. If we can hold that valuation level, the market will again advance as stocks realize double digit earnings growth.
Eric Barden, CFA