The economy, and corporate earnings are supporting a continuing increase in stock prices.
2017 is proving to be a better than average year. Our fixed income portfolios are up about 3.5% year-to-date, while our equity portfolios are up between 10% and 15%. The most remarkable aspect of the stock market in 2017 is the almost complete lack of volatility. The largest retreat from all-time highs has been a meager 3%. On average, the market endures a drop of about 14% from the high for the year. This placid state is not normal, but there is no indication that it is going to end anytime soon.
As we begin to position your portfolio for 2018, my primary assumption is that the economy will continue to grow. If we don’t get a recession in 2018, earnings will continue to grow, and stock valuations will continue to expand. Under these conditions, a 10-20% return for 2018 is most likely.
The global economic recovery is exceeding expectations. The U.S. workforce is recovering due to greater employment, modest wage gains, and the rapidly improving housing market. This allows earnings to grow faster than anticipated.
Inflation remains moderate
The risk of a long period of economic growth is that it tends to kick off a period of higher inflation. Since World War II, the typical recession results from the Federal Reserve substantially increasing interest rates. For many reasons, inflation remains surprisingly low and the Fed has had to pursue a much more deliberate pace of rate increases.
While mortgage rates will rise modestly, they will remain at historically low levels. Combined with stronger job and income growth, the net result may be strong growth in household formation, construction, and home sales.
Severe bear markets are rare outside of an economic recession
The most consequential bear markets coincide with economic recessions. That’s not to imply that the market can’t go down without a recession. Thirty years ago, the market dropped 23% in one day, before recovering all its losses by the end of the year. The crash in October of 1987 occurred within the context of the 1980s economic boom. The strength in the underlying economy helped the market to completely recover its losses by the end of the school year.
Stock prices are a function of two variables: earnings, and the multiple of earnings that investors are willing to pay. Earnings tend to follow the economy. If the economy is growing, then so are earnings. Valuations also tend to increase as the economy grows. Periods of growth inspire higher confidence which translates into higher stock market valuations. Years in which the economy grows tend to deliver higher than average returns for the stock market.
If the economy continues to grow, we will most likely earn higher than average returns
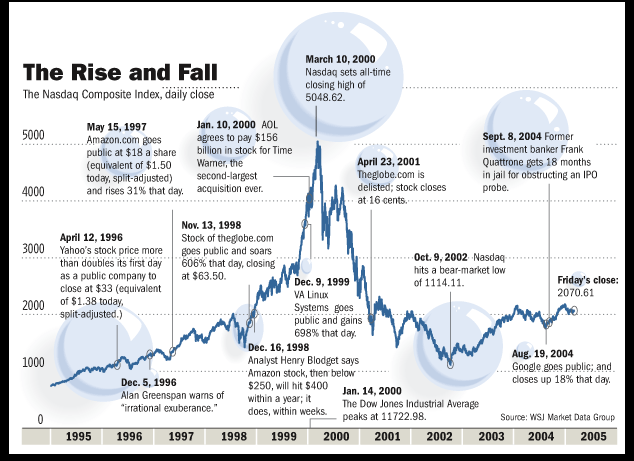
As we begin the 4th quarter of 2017, the storyline is that the current market environment is unique relative to history, and that there is very little to suggest that this exceptional environment will change anytime soon. But, history gives us an indication of how the peak and eventual correction will occur. Over-confidence turns into euphoria, which eventually results in complacency. Stock market investors experienced this most acutely during the late ‘90s dot-com bubble.
The challenge is in knowing where exactly we are in the cycle. Sometime during 1998 it was clear to me that stock market prices in the most popular industries had become detached from any fundamental reality. That was four years before the NASDAQ reached its eventual low.
Don’t let the pundits fool you. This is nothing like the late-90s tech stock bubble.
Sometimes, the hare beats the tortoise, but not over the long-term.
Would investors have been better served if we took their money to the internet stock casino? A lot of people did very well. Mark Cuban made his billions by selling an overvalued company to Yahoo. Jeff Bezos saw the value of Amazon drop 95%, but he rode it out and his persistence has paid off amazingly well. But for every Jeff Bezos there are tens if not hundreds more visionaries whose companies completely collapsed.
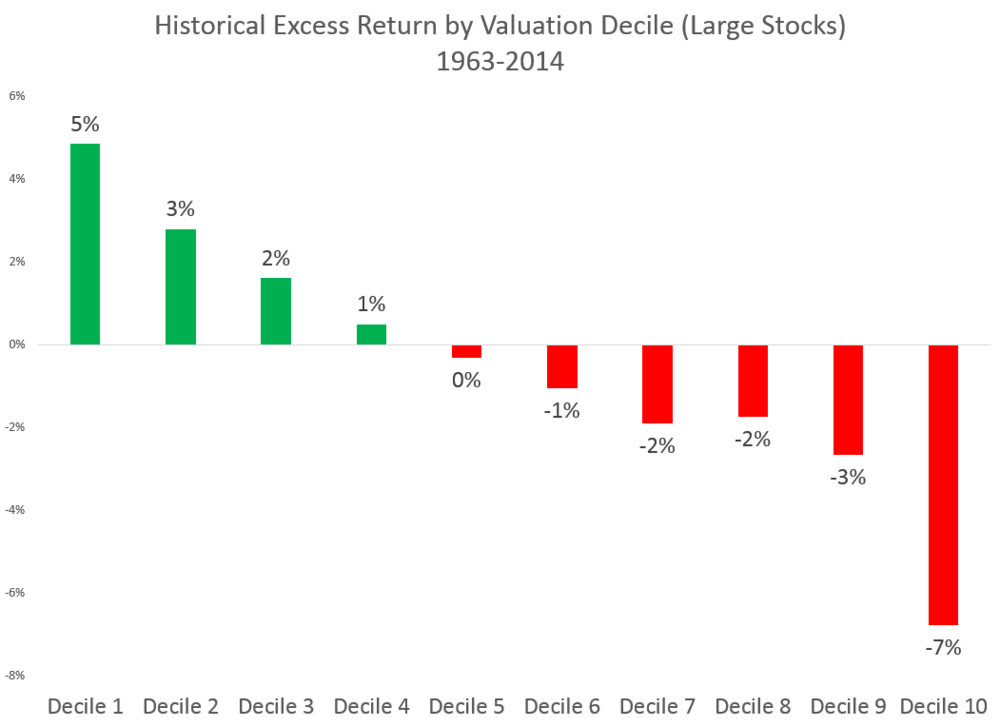
Historically, the most expensive stocks underperform the market. In the chart below, decile 1 is the lowest valuation stocks and decile 10 is the highest valuation stocks. There are periods when the hare leaves the tortoise in the dust and we can see some similarities between today and the late ‘90s. Despite the historic underperformance of over-priced stocks, cheap stocks are substantially lagging high-priced stocks this year.
Lowest Valuation Stocks (Decile 1) Outperform Highest Valuation Stocks (Decile 10)
Biggest challenge during later stage of bull market is to avoid chasing over-priced stocks
Latter stages of economic expansions challenge our investment disciplines. As confidence runs high, it is so easy to jump into a company with a soaring stock price like Tesla—until we look at the financials. Tesla is burning through cash at a historic and accelerating rate. It has $3 billion in cash on hand and is spending $1.16 billion in cash quarterly. It’s clear that Tesla will have to raise additional capital if it hopes to continue operating. That is not good for current investors. The price performance of Tesla seems disconnected from the economic performance of the company.
In today’s slow-growth economy, growth is at a premium. Apparently, there is no limit to how much investors are willing to pay for the possibility of superior growth. The increased use of index funds also undermines the pricing discipline of the stock market. Passive investing buys into the market as it exists today without regard to the rationality of current market prices. Market history suggests that even if the superior growth materializes, the stock prices will eventually come back to earth. My personal history suggests that identifying these turning points are extremely challenging.
It’s not timing the market, but time in the market.
3,000 on the S&P 500 is a possibility for next year. Very few people would have thought that such a recovery was possible when the S&P 500 traded below 700 just eight years ago. Going back even further, 30 years ago today, the Dow Jones closed at 1,738. Today it’s near 23,000 generating a modest 9% annually since the crash.
Markets bottom when pessimism is widespread. They peak when investors are overconfident or even euphoric about the future. Based on my experience of euphoric market peaks, we’re not there yet—but we’re slowly moving in that direction. Regardless of where we are in the cycle, owning a part of the world’s greatest companies is the best strategy for individuals to generate substantial wealth.
Eric Barden, CFA