From the beginning of the year through the end of the second quarter, our equity allocations are up more than nine percent and our bond allocations are up about four percent. Stock and bond returns have done in six months what we hope they do in an average year. The good times won’t last forever, but it doesn’t yet look like there is a storm on the horizon.
Fortunately for investors, the biggest surprises are coming from Washington and not the Federal Reserve or Wall Street. The economy maintained its slow and steady pace of growth. Economic growth drove revenues and corporate profits higher.
Despite the political uncertainty, the market continues to march steadily higher
Investors have been earning below average returns over the last three years, but 2017 is proving to be much more productive. Globally, stocks are up about ten percent through the first half of the year. Short-term interest rates have moved up modestly, but no more than what the consensus was projecting at the middle of the year. Long-term interest rates stayed in a narrow range and are currently at roughly the same level as they were at the beginning of the year.
At the half-way mark for 2017, we are on pace to match our return projections for fixed income of four to five percent. If stocks maintain this pace for the rest of the year, they will substantially exceed our return projections of about nine percent.
Valuations are reasonable. The market should continue to advance with sustained earnings growth
As we discussed in our previous report, this is one of the most prolonged bull markets in history. The pessimistic outlook believes that bull markets have a maximum life expectancy of eight or nine years at the most. This bull market began in 2009 so more analysts are calling for danger ahead, with very little substance to back up that assessment. The primary argument is that valuations are modestly higher than average. This doesn’t tell us how high valuations can go, nor does it inform us as to what causes valuations to rise or fall.
The S&P 500 trades at 18.7 times 2017 earnings. If we assume that valuations stay the same, future stock returns will be a function of future earnings growth. In 2018, earnings are expected to grow 11.6%. If earnings forecasts are correct, and stock valuations stay at this level, the S&P 500 index will move up to 2,750. Including dividends, this implies a total return of about 14%.
It does not appear that a recession is imminent
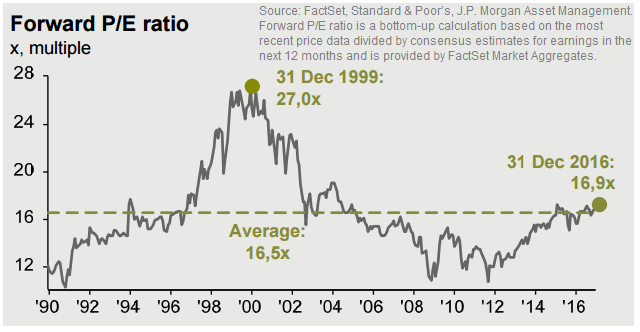
Since 1870, the average P/E ratio is about 17, but the range is between 10 and 30. The market could go much, much higher before stocks bump up against a valuation ceiling. The worst that can be said about today’s valuations is that they are modestly higher than average.
We need to figure out what causes valuations to go up and down. I haven’t found a lot of research on this topic. Relying on my own twenty plus years of experience, it seems that stock valuations tend to go higher if profits and the economy are growing.
A bear market occurs when the economy turns negative and earnings estimates fall. Concerned and cautious investors will pay a lower multiple of lower earnings. If earnings decline 10% and valuations decline 20%, the market falls 28%. The combination of declining earnings and lower valuations triggers the most substantial bear markets.
The good news is that there is little reason to suspect that a recession is imminent. There are few obvious economic imbalances. Underwriting standards are more rigorous, and banks are far better capitalized than they were in the years preceding the credit crisis of ten years ago. The market continues its slow and steady climb with very little volatility. Earnings are coming in better than expected. A weaker dollar is evidence of a surge in non-U.S. economic growth. Europe economic indicators are as favorable as they have been in a decade. Next year, the risk of a recession rises to perhaps 25%. My forecast is for another 18 months of above-average market returns. If the economy continues to expand, earnings will grow, and valuations will increase.
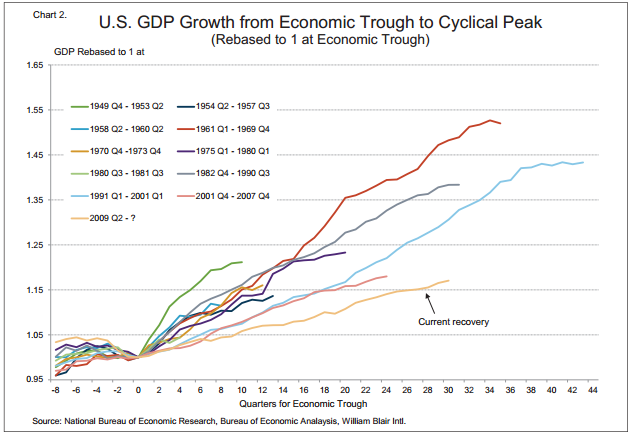
The global economy is becoming less volatile
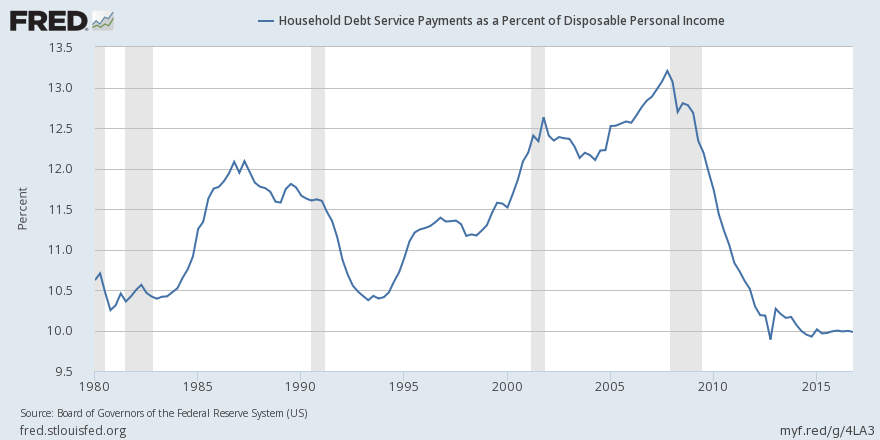
The key to this expansion’s longevity is that it is one of the weakest expansions on record. The financial meltdown of ten years ago taught households, corporations, and banks that too much debt is potentially catastrophic. Over the last ten years, household and corporate savings increased while nearly all sectors of the economy paid off a substantial amount of debt. Higher savings necessarily decreases spending. The massive deleveraging that we’ve seen in the economy has greatly reduced economic volatility. There is no sign of the typical excesses that precede a recession.
The underlying nature of the economy is also changing. The 1800s, during which the economy was almost entirely agrarian, was a period of extreme economic volatility. The U.S. suffered six periods of economic collapse—each as severe as the S&L crisis of the late 1980s. The depressions of the 1800s tended to last five years or more on average.
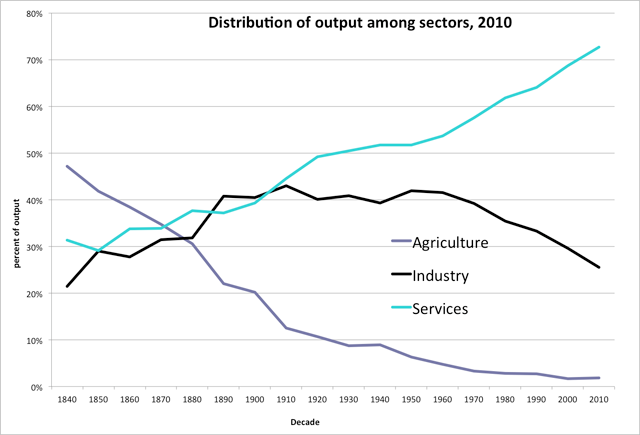
The economy is increasingly based on services, not industry
As we moved into the 1900s, the industrial revolution transformed the U.S. economy into an industrial based economy. The business cycle became much less volatile, but the economy was still very sensitive to changes in interest rates and commodity prices. The innovations of monetary policy and fiscal policy gave us tools to help stabilize the economic cycle. Recessions become much less likely to turn into depressions. The development of counter-cyclical policies like unemployment insurance and interest rate cuts reduced the likelihood that a recession would turn into a full-blown depression.
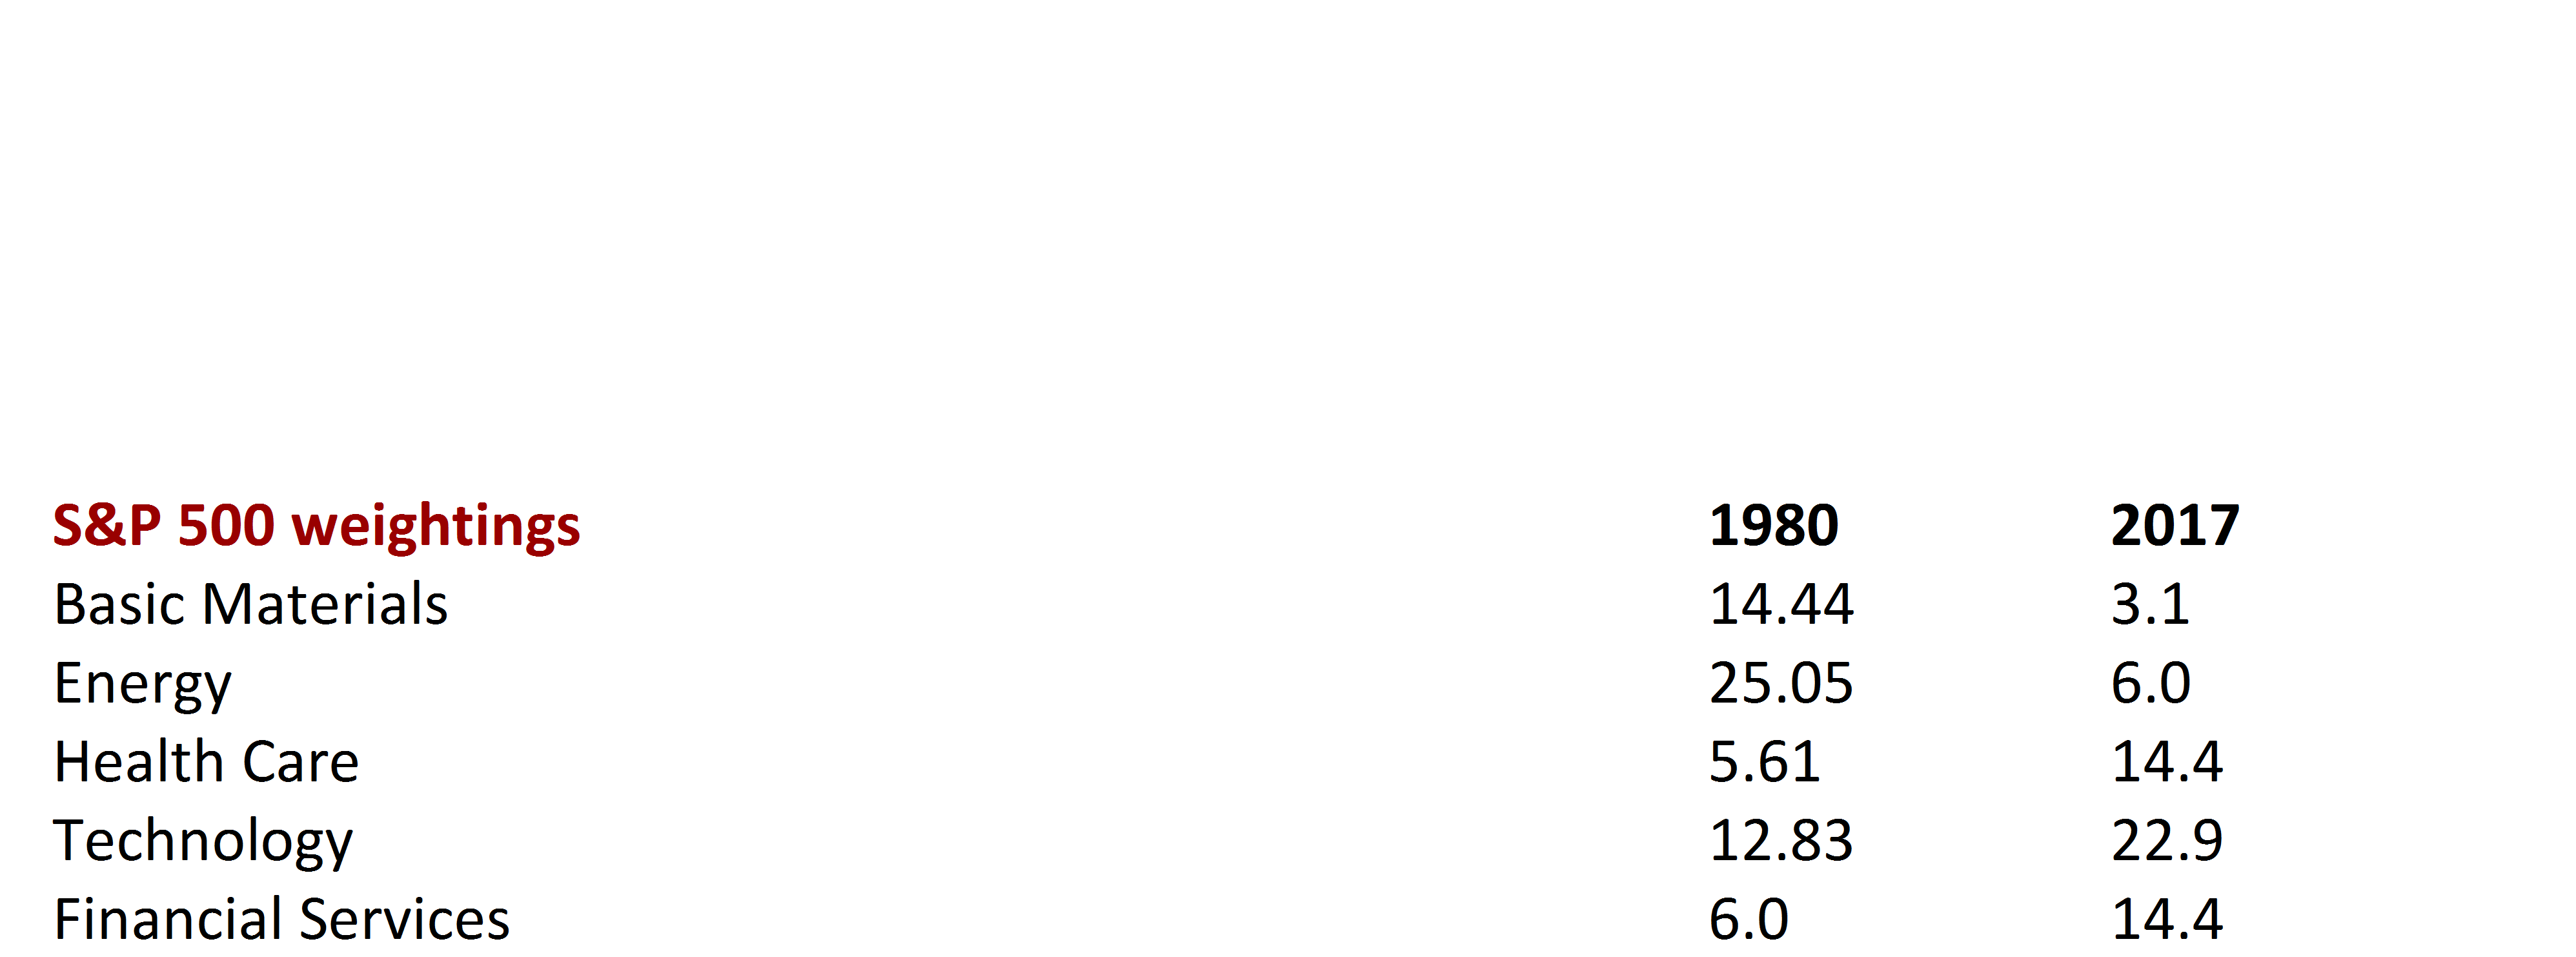
Over the last generation or so, the U.S. economy has transformed into a service based economy from an industrial based economy. The finance, health-care, entertainment, and technology industries dominate the economy today, while sectors like energy, basic materials and manufacturing are of lesser importance. In 1980, the most volatile sectors, energy and basic materials, were 42% of the S&P 500. Technology, finance and health-care represented only 18% of the market. Seven out of the ten largest companies in the S&P 500 were energy companies. Today, energy and basic materials are only 9% of the market while technology, finance and health care are 55% of the S&P 500.
Most volatile sectors like energy and commodities are less of a factor in today’s economy
Energy and basic materials are subject to extreme booms and busts—not unlike the agrarian economy of the 1800s. As the economy evolves beyond the extraction based industries, the interval between busts increases. The collapse of energy prices in 2014 and 2015 did not blow up the entire economy. The bust was contained to energy and basic materials companies.
Recessions aren’t as frequent for services based economies.
A service based economy has a very different profile than what we’ve historically experienced. Service industries are more stable and predictable than energy or basic materials. They are less sensitive to the cost of labor and commodities than traditional manufacturing industries. Service companies are more scalable, meaning that as they grow their profit margins increase. Lower wage inflation and commodity price inflation leads to lower interest rates. Slower growth and lower inflation decreases the frequency of recessions. If we have fewer recessions, fewer bear markets, and a more stable growth outlook, investors should be willing to pay a higher multiple of current earnings. The only question is how much higher.
The bad news is that once the economy peaks and a recession ensues, the next bear market will likely be more severe than most. Hopefully, most investors will take the next downturn in stride, though history suggests that they probably won’t. It’s been a long time since the market pulled back even a modest 5%, so we should expect that this increase in confidence will eventually yield to complacency.
Your asset allocation is designed to take care of your long-term income requirements
It’s very important for you to understand how your portfolio reflects your specific investment objectives. We separate your portfolio into three segments. The first segment is for income that you will need to draw from your portfolio within the next year. For these assets, the top priority is liquidity. So, we keep these funds conservatively invested in money market type investments.
For assets that you expect to utilize sometime within the next five years, the top priority is that you maintain your current purchasing power. This segment of your portfolio must keep up with inflation. High quality corporate and municipal bonds, as well as bonds from government agencies make up the dominant portion of this segment of your portfolio.
We buy stocks with the assets that you expect to keep invested for at least the next five years. This puts our clients in a much stronger position versus the proprietary traders and hedge fund managers whose bonuses depend on three-month or one-year returns. On average, the market has dropped twenty-percent every five years or so, and thirty percent about every ten years on average. In almost every case, the market worked its way back to a new high within five years.
Long-term savings should go into high return strategies
Timing the market is notoriously ineffective, even before adding in transaction costs. It is far more productive to get the asset allocation right before the sell-off occurs. When volatility hits, we use it to our advantage by rebalancing the portfolio. The only trading strategy is to buy inexpensive assets at a low price and sell them when they are priced relatively high.
For now, we should enjoy the party while it lasts. We’ll deal with the cleanup later.
Eric Barden, CFA