Stocks are flat over the last couple of years as we continue to work our way through an earnings recession
The markets continued the holding pattern that has persisted for the last couple of years. Over the last two years, international stocks are down about 14%, while U.S. stocks are up about 14%. Global benchmarks are anywhere from down 4% to up 3% over the last two years–depending on the weighting between international and U.S. based companies. The latest stagnation is disappointing given that historically the market goes up about 9% a year.
Benchmarks are a little bit like opinion polls. There are many indexes that attempt to measure the same markets. But, each index provider has a unique method. Over time these differences tend to average out, but over shorter periods of less than five years, these differences can have an outsized effect. The more important objective is risk adjusted return. Are you earning adequate compensation for the risk that you’re taking?
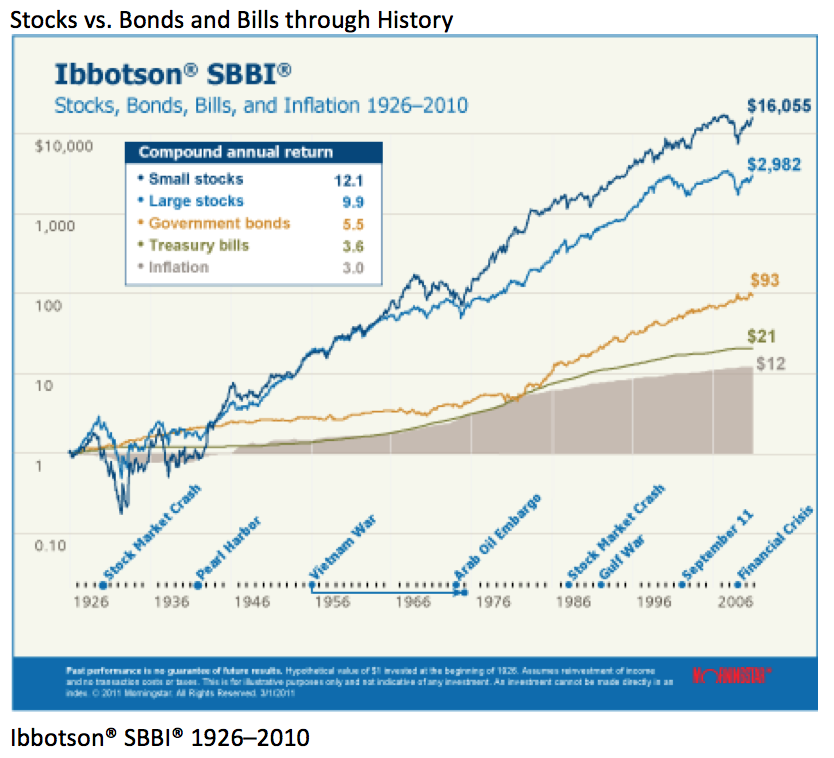
This is one of the first charts I saw as an investment professional. This classic chart from Nobel Prize winner Roger Ibbotson shows the past performance of asset classes across the risk spectrum. This graph shows the growth of inflation and a $1 investment in four traditional asset classes from January 1, 1926 through December 31, 2010.
Is there now such a thing as a free lunch? Low risk bonds rarely beat stocks over ten years. Will bonds continue to beat stocks, or is this just a fluke?
One of the most fundamental laws of economics is that there is no such thing as a free lunch. To achieve maximum growth, you must take maximum risk. The safest assets are the least productive growth vehicles. Risk characteristics effectively predicted the long-term performance of capital markets over the last 85 years. That has not been the case over the last ten years. The Bloomberg Barclays Aggregate Bond index is up 4.6% a year over the last ten years and the standard deviation of returns, a measure of volatility, was 3.2% over the same period. The MSCI All Country World Stock index is only up 4.34% over the last ten years – less than the bond index, but the standard deviation has been 17.2%. If the new normal is for fixed income to match or exceed stock returns, but with only one-fifth the volatility of stocks, why would anyone in their right mind stay invested in stocks?
The physics of the natural world are easy compared to the physics of capital markets. Natural laws are in force over both the short and long run. The question is what will be the law of the capital markets over the next ten years. Will low-risk assets like bonds continue to achieve returns comparable to or in excess of “risk” assets? Or will risk assets like stocks make up lost ground by outperforming their historic returns over the next ten years?
Over the last 85 years, there have been 14 periods during which bonds beat stocks over ten years. Six of those instances have occurred since 2007. The probability of experiencing this historic anomaly is about one out of six. So, in five out of six periods, stocks have beaten bonds over ten years. Based on historic data, stocks are the overwhelming favorite to beat bonds over the next ten years.
Currently, the link between the performance of a business and the performance of its stock is weak.
It used to be that stocks were fairly responsive to changes in the fundamental outlook of a business. This is not the case as much today. Different strategies and the growth in index based investing have weakened the link between the success of the business and success of the stock.
The performance of our business is not yet reflected in the prices of our stocks.
We invest based on the outlook and the value of our businesses. Over the last three years, our portfolio of businesses has grown earnings by 6.7% a year. This compares favorably to the S&P 500 earnings growth of only 3.8% a year. Over the last five years, our businesses have on average grown earnings 13% a year, compared to only 5.5% for the S&P 500. Not only have our businesses outperformed the rest of the market, but they are priced at lower valuations than the rest of the market. Our companies trade at 2.1 times book value, while the S&P trades at 2.7 times book value. The ratio of our companies’ price to cash flow and earnings is also cheaper than the rest of the market. Owning faster growth companies that are cheaper than the market is the best way to outperform the market.
It’s is effectively impossible to anticipate how a particular stock is going to trade over the next few months. We have much better visibility on how a business will perform over the next six months than we do on how the stock will perform. There are so many factors that cause stocks to get bought or sold. Perhaps a minority of those factors, especially in the short term, have anything to do with how the underlying business is performing. However, if we own good growth businesses at a favorable price, the intrinsic value of our investment grows with the business. What we cannot know is when the market will properly value our business, only that it will happen eventually. If not, the owners of the business will either buy out the public shareholders and take it private, or another company will come along and buy the business outright at a price that reflects intrinsic value, not the value that the market assigns to it.
As hard as it is to do sometimes, investors should pay more attention to how their businesses are performing than how the stock price of those businesses is performing.
Perhaps once we get through the election, and the next interest rate hike, investors will once again focus on income statements.
Investors are hunkering down, waiting out three major uncertainties
Investors remain preoccupied with three impending events, and until these uncertainties are resolved, markets are likely to remain in a narrow range. First, investors are anxiously awaiting the outcome of the election. Second, investors presume that the Federal Reserve will raise interest rates by the end of the year. Finally, investors are optimistic that the end of the earnings recession that has persisted for nearly the last two years is in sight.
Big, dramatic presidential elections don’t tend to help market performance. Often, the market treads water leading up to the election. Once the election occurs, the market typically rallies through the end of the year as one major uncertainty is finally resolved. If we get an earnings recovery at the same time we are recovering from our long national campaign, I would expect to see a substantial rally through 2017.
In 2015 and 2016, optimistic analysts forecast that earnings would grow between five and ten percent annually. Ultimately, reality did not conform to expectations. The collapse in energy prices and a strong dollar caused earnings to decline in 2015 and 2016. We are now in our seventh straight quarter of declining earnings. It’s not a coincidence that the market has effectively gone nowhere since earnings peaked back in the spring of 2015.
Earnings recessions that occur independent of a recession in the economy are pretty unusual. Generally, when we see earnings decline for seven quarters in a row, the economy is in the midst of a significant downturn. Previously, once these earnings recessions ran their course, the market moved substantially higher over the following year.
The market has digested two recent shocks to earnings, collapsing energy earnings and a strengthening dollar. The good news about energy earnings is that they can only collapse once. Energy earnings are down almost 90% in the last year, but for the next year, revenues are expected to be up 24%. What was once a strong headwind will turn into a modest tailwind. This turnaround has a substantial impact on overall earnings.
An earnings recovery in 2017 should support better stock market performance
The Earnings Recession Is Almost Over
It seems that we are nearing such an inflection point. Earnings estimates for next year are holding up much better than they did in 2015 and 2016. Investors evaluate earnings based on how they compare to the previous year’s earnings. Estimates are still likely too high, but it’s safe to say that the earnings recession is finally ending.
The market doesn’t seem to anticipate the impending earnings rebound. Investor sentiment is still very negative. It’s the surprise factor that forces prices to adjust higher.
Over time, stock prices follow earnings. Earnings follow the economy, which will grow as long as the population is growing and productivity is increasing. This growth doesn’t happen in a straight line. We experience periods of negative economic growth and earnings growth which will temporarily cause the market to stagnate or even decline. Usually, earnings recessions coincide with economic recessions, but not always.
The key point to remember is that earnings recessions are temporary. When earnings reach the inflection point for the cycle and rebound, they take the market back up as well. On average, the market has jumped more than ten percent in the year after earnings bottom out.
It seems likely that we are on the cusp of a turning point for earnings. If earnings grow between five and ten percent over the next twelve months, stocks should produce very healthy returns. After almost two years of waiting, the next rally seems overdue.