In spite of negative investor sentiment, and mutual fund cash allocations at their highest since 2008, the market somehow powered its way to a record high. The question now is whether the second longest bull market in history can sustain another rally.
Stocks look cheap relative to interest rates, implying more risk for fixed income than stocks
The current earnings yield for the S&P 500 is about 6%. This is pretty much in-line with the long-term historic average. The equity risk premium is the spread of the earnings yield over the yield on long-term treasury bonds. Treasuries yield about 1.6% so the equity risk premium is 3.4%. This is higher than the historic average. At current interest rates, an equity risk premium of 2% means that the S&P 500 would trade at 27.8 times earnings. 2017 earnings are projected to be $125. This is a long way of showing that if the market traded at the same average risk premium as it did in the ‘90s, then the S&P 500 would be about 60 percent higher than it is today.
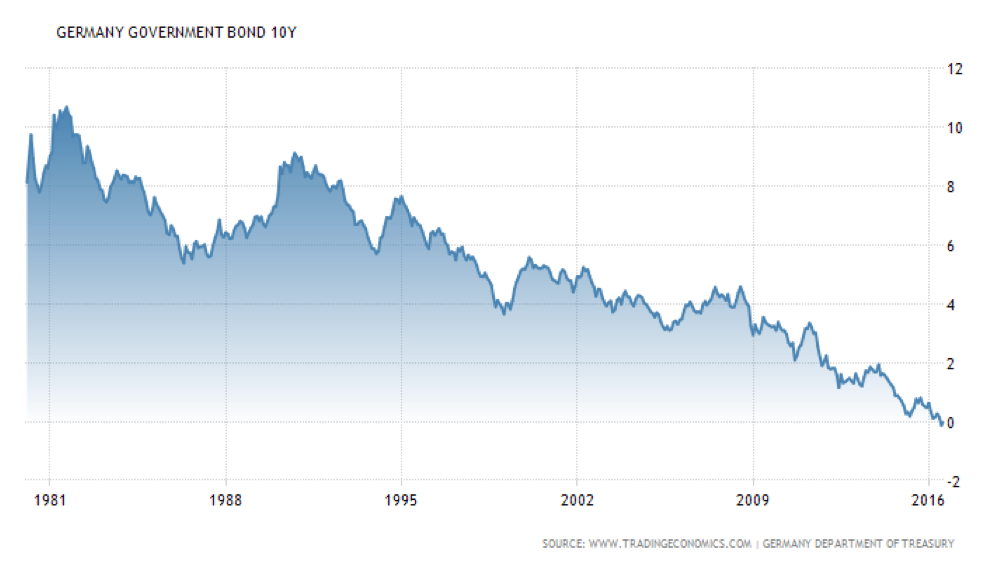
Interest rates could still go lower. U.S. rates are high in comparison to other high grade government bonds.
Currently, there is a disconnect between interest rates and stock valuations. Stock valuations imply that interest rates will eventually move much higher. Interest rates are down all over the world. $7 Trillion dollars of government debt, or 29% of all government debt outstanding, are paying negative yields. In other words, 30% of government bonds around the world are charging rent to investors who own the bonds.
The 10-Year Treasury is paying 1.58% more than the comparable German bond and 2.1% more than the Swiss 10-Year bond. Uncertainty surrounding the Brexit vote stimulates global capital flows out of Europe and the U.K. and into the U.S. The increase in demand for the dollar causes the dollar to appreciate against the European currencies. A strong dollar enhances the appeal of U.S. investments to global investors.
We are in the eighth year of economic expansion. Most economists believe we’re probably in the 4th quarter of this growth cycle. Economic growth is slow and steady, and we don’t yet seem to have a lot of the excesses that point to an imminent crash. The nature of the economy has changed. We are much more service oriented than during previous cycles. Service industries tend to be much more stable than manufacturing or farming industries.
More stable economy means lower volatility for markets
The bond market is suggesting that the new normal lacks the rapid economic growth of the past. If this slower economy is less volatile, and recessions are less frequent then we should expect lower volatility in the stock market. Indeed, this is what current volatility indicators are projecting.
The required rate of return for stocks is the risk free rate plus the equity risk premium. When the required rate of return falls, stock prices go up. If the required rate of return decreases by 1%, stocks would return about 20% over the next year.
The risk free rate and equity risk premium make up the required rate of return on stocks. The path of least resistance seems to be lower for both. A lower capitalization rate for stocks means higher prices.
We have two possible paths of cutting 1% from the required rate of return—the risk free rate and the equity risk premium. U.S. Treasuries reflect the “risk-free” rate for investors. It seems likely that U.S. rates will continue to decrease as global investors are attracted to the higher rates than what is available in the U.K., Germany or Japan. Some bond experts are looking for rates to fall .6% to 1% from the current 1.6%.
If the economy and stock market are moving into a new era of lower volatility and risk, it seems that the equity risk premium is likely to decrease. During the ‘90s, the equity risk premium ranged from a low of only .4% to a high of about 3.4% and averaged about 2%. It’s reasonable to project that the equity risk premium declines at least one-half of a percent from 3.5% to 3%.
Something has to give. If there really is a “new normal” that entails lower interest rates across the board, the equity risk premium will eventually fall and stock prices will eventually appreciate.
Brexit creates uncertainty but presents only limited risks to the U.S. economy
For the first six months of the year, the STUB trade led the way. STUB is short for staples, telecommunications, utilities and bonds. These sectors represent the highest yielding, slowest growth industries. The over-valuation of this segment of the market relative to the rest of the market is extreme. Historically, whenever a group of stocks gets a cute acronym nickname, its era of dominance is about to come to an end. Based on elevated valuations, these sectors of the market are likely to substantially underperform over the next few years, so we are underweight these sectors. Our lack of exposure to these sectors hurt our relative performance in the first half of the year.
Should You Be Worried about the Brexit?
The markets were shocked recently by the results of a United Kingdom referendum. Analysts saw very little likelihood of the British public voting to leave the European Union. In a close 51-49 vote, Great Britain voted to do just that. So, now investors need to figure out the implications, and what action if any they should take in their portfolios.
The effect of a Brexit vote on the United States is limited by the U.S. economy’s small economic exposure to the United Kingdom. U.S. exports to the U.K. are only about 0.7 percent of U.S. GDP. Even if the U.K. falls into recession as a result of Brexit, the hit to the U.S. will be small. European growth is also likely to suffer, although Europe is less likely to fall into recession. This could create another small drag on U.S. growth: exports to the Eurozone are about 2 percent of U.S. GDP.
The more important risks to the U.S. are secondary. Greater risks to global growth and increased market volatility could make U.S. businesses more reluctant to invest in operations. Uncertainty and volatility will also push investors towards the safety of the U.S. dollar, increasing the relative value of the dollar. A richer dollar will make U.S. exports more expensive internationally and imports to the U.S. less expensive, which will tap the brakes on U.S. growth. Fortunately, consumer spending and housing are the primary drivers of U.S. growth. These sectors are less affected by the stronger dollar.
Recall, that earlier this year, the markets fell about twenty percent. This significant volatility in the markets did not lead to either a U.S. or global recession. Shocks in the financial markets don’t usually lead to a general economic downturn. International instability actually creates higher demand for U.S. based investments. Higher global demand for U.S. assets is a big reason that interest rates are as low as anyone can remember.
There is substantial pent-up demand for housing in the U.S. Rates have already come down dramatically in the wake of the Brexit vote, with the yield on the 10-year Treasury falling to around 1.40 percent, near its all-time low of 1.38 hit in 2012. Lower interest rates increase the number of people who are able to buy homes.
The bottom line is that stocks are a long-term investment. When volatility hits and stocks are undervalued, you should only sell as a last resort. For long-term investors, these kinds of shocks have historically proven to be great opportunities.
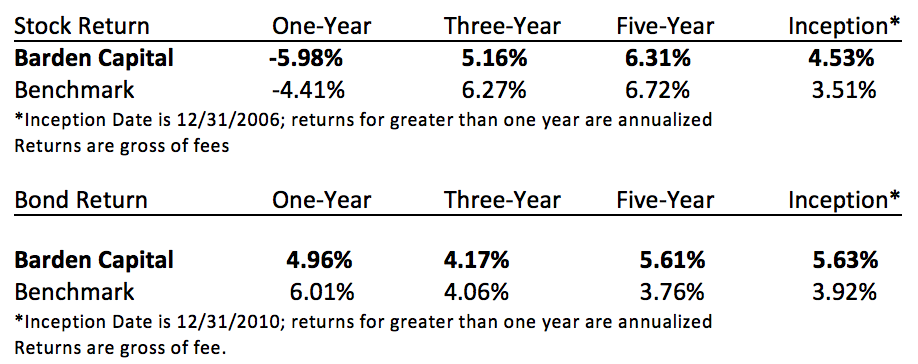
BCM Returns are based on a size-weighted composite of BCM assets under management at the end of the period. The Stock Benchmark is a blended composite benchmark that reflects the underlying asset class target allocation to corresponding market index components and is gross of fees. The following market index components were used in the construction of the benchmarks: for U.S. stocks, the MSCI U.S. Broad Market Index; for Non–U.S stocks, the BNY Mellon ADR Index; and for bonds, the Barclays Capital Aggregate Bond Index (formerly the Lehman Aggregate Bond Index). The indexes are unmanaged and do not incur management fees, transaction costs or other expenses associated with managed accounts.