The market experienced a fairly substantial sell-off in January. Commentators observed that it was the worst start to a calendar year in history. Crashing oil prices, potential Chinese currency devaluation, and uncertainty about the pace of interest rate increases combined to confuse and frighten Wall Street.
In the short term the market is a voting machine, in the long-term the market is a weighing machine
After a horrendous start to the year, markets appear to be stabilizing. The economy is sending mixed signals. Employment continues to improve, along with consumer confidence. One weak spot in the economy is the level of investment by corporations in their own operations. CEOs seem to prefer to buy back stock over increasing their investment in future growth. Until oil prices stabilize and the dollar stops strengthening against foreign currencies, CEOs will only cautiously invest in future growth.
Slow global growth, but no recession in 2016
Don’t See Imbalances That Will Lead to Recession
This will hold back the economy somewhat, but it also prevents the economic imbalances that can lead to a recession. The recession of 2001 served to correct the excess allocation of capital into the technology sector. The recession of 2008 corrected the misallocation of resources into the housing sector. It’s possible that the correction of the excess investment into the energy sector will lead to a recession, but energy is a much smaller segment of the economy than technology and housing. Without an unforeseen shock to the economy, the most likely scenario is for continued modest growth in 2016 with the stock market reaching new highs.
Most investors are aware of the perils of market timing. This quarter is just another example of the near randomness with which the market moves in the short term. Selling out in the midst of turbulence, then reinvesting after the market calms down hurts investors in three ways. First, higher transaction costs and expenses lower the return that investors are able to achieve. Second, most investors who attempt to time the market end up selling low and buying higher, which erodes their long-term return. Finally, realizing gains short term incurs very high capital gains taxes. If you held a position for less than one year, your capital gains taxes could be as high as 38%–more than twice as high as if you held for more than one year.
Importance of Tax Efficiency
Investment literature consistently warns of the problems with paying high fees for wealth management. Marketing literature focuses on average annual returns. Less understood is the impact of the tax cost ratio. The tax cost ratio measures the percentage of your assets that go to pay annual taxes on your investment portfolio. A typical mutual fund will cost investors about one percent a year in taxes. But some funds cost investors three to four percent of their investment each year.
Mutual funds typically focus on pre-tax returns
Investors who use mutual funds relinquish control of their ability to manage taxes. Mutual funds are generally ranked based on their pre-tax performance. The incentive is for managers to maximize performance regardless of the tax implications. If we assume long-term returns will average about ten percent a year, an investor who pays four percent a year in taxes will earn six percent a year after taxes. For a $100,000 portfolio, this amounts to more than $80,000 over ten years.
Minimizing the tax cost ratio of your portfolio is perhaps the easiest way to improve your long-term investment returns. The tax cost ratio potentially costs you two to three times as much as management expenses. Tax costs are not an issue for investors in non-taxable accounts like 401k plans or IRAs. But, if you invest through a taxable account, after tax returns are the only relevant measure of the productivity of your portfolio.
Tax Cost Ratio may impact long-term performance even more than fees and relative performance
By owning stocks directly, we are in control of when we realize gains and losses. We avoid selling any winning positions until we have held them for at least a year. Short-term capital gains devastate the after tax return on a position. We hold onto our companies that are showing consistent growth and outperformance versus the market. We first bought Adobe software in 2010. Over the last six years, our original investment is up 300%. Adobe is undervalued below $105 a share. Currently trading at $96, we will continue to benefit from the long term growth of the company. If the price of the stock reflects overly optimistic growth expectations, we will sell it. Until that time, we will hold the position and enjoy tax free appreciation.
Long-term ownership of companies defers the payment of taxes on the gains
We can realize losses without substantially altering the character of your portfolio. In some cases, we can buy a substitute company in the same industry. If we want to buy back the company that we sold, we wait thirty days from the time we sold the position, and perhaps even buy the company back at a lower price. The ability to realize gains and losses as a tax management strategy has allowed us to be more tax efficient than many index funds, including the Vanguard S&P 500 index fund.
The President is not a Caesar
Election Season
The political season is here again. This year promises more surprises than usual. Some investors have a tendency to view the economy through a partisan lens. Political partisans sometimes view a loss as almost apocalyptic. I know of many investors who have stayed on the sidelines for the last eight years out of concern about an economic collapse that has yet to occur.
Many political theorists argue that the President is not as powerful as we perceive him to be. We think of the President as having control over the economy or international conflicts. While the President can advocate for a policy, he can’t just implement it. Think of the President as a co-pilot of a plane that is flying on auto-pilot. A divided congress leads to gridlock. The Supreme Court has the ability to overturn laws that it views as unconstitutional. The presidency is just one piece of a very large government pie.
Historically, politics has had a negligible impact on the market
Historically, the market returned almost nine percent a year under Democratic presidents and was roughly flat under Republican presidents. Once you take the Hoover administration out of the equation, the picture becomes more mixed. Markets have enjoyed strong returns under both Democratic and Republican administrations, but it’s almost impossible to separate correlation from causation.
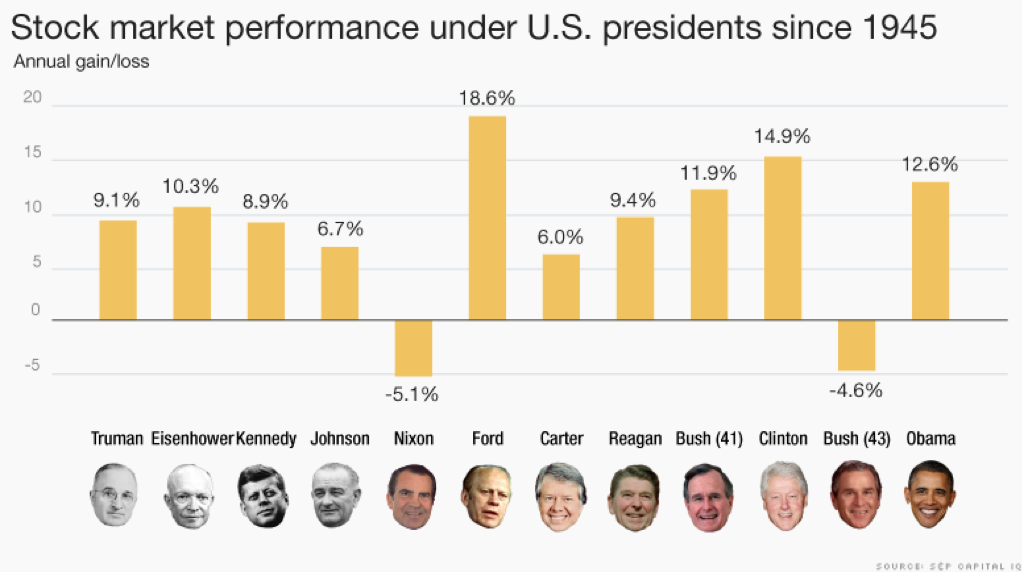
I’m skeptical that the President has much of an impact on the performance of the market. Enjoy what promises to be an entertaining election season. Even if things don’t work out for your candidate, the United States still has advantages that are the envy of the rest of the world.
Department of Labor extended the fiduciary requirement to cover all advisors who manage retirement accounts.
Suitable or Optimal?
The Department of Labor recently announced new rules requiring that financial advisors to retirement plans act with their client’s best interest in mind. Previously, brokers and insurance salespersons operating under the “suitability standard” were merely required to ensure an investment is suitable for a client at the time of investment. This contrasts with the “fiduciary standard” where registered investment advisors, or RIAs, and Employee Retirement Income Security Act-appointed fiduciaries must avoid conflicts of interest and operate with full transparency. The President’s Council of Economic Advisers estimates that non-fiduciary advice costs Americans one percentage point of their return annually, which amounts to $17 billion each year. The new rules essentially limit advisors who operate as a non-fiduciary to non-retirement accounts.
A non-fiduciary advisor, acts as a broker. After the transaction, the non-fiduciary has no further obligation
To illustrate the difference between these two standards, consider a client who is, by their own description, a long-term investor. Under the suitability standard, a broker may decide that the majority of savings should go into a mutual fund. The prospectus tells the client in legal language that the fund is operated by the bank that employs the broker, and that the broker receives a perpetual fee on top of the sales commission they receive. These fees can become a significant cost over time, compared to the explicit fees of a fiduciary advisor.
A broker has no further obligation to monitor this client’s investment. Under the suitability standard, the financial planning process can begin and end in a single meeting. Without a fiduciary, the client is ultimately responsible for all of the investment decisions.
A fiduciary is required to act in the best interest of a client
Under the fiduciary standard, an investment advisor has a “duty to care” and must continually monitor not only a client’s investments, but also their changing financial situation. Did the client’s risk tolerance change? Do changing investment objectives require a change to the client’s asset allocation? Are the investment strategies in place the most cost efficient and productive?
If one advisor is a fiduciary and the other is only held to the suitability standard, the difference in fees may not paint the full picture. Investing with an advisor who has your best interests at heart could pay handsomely over time. The vast majority of investment professionals are well-meaning and capable. But as in any industry there are a few bad apples. It’s much easier for a non-fiduciary to get away with self-serving investment suggestions than it is for a fiduciary.
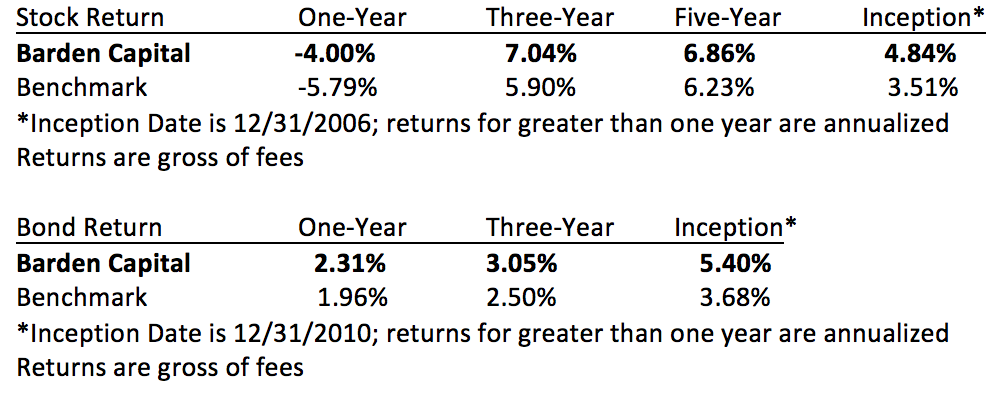
BCM Returns are based on a size-weighted composite of BCM assets under management at the end of the period. The Stock Benchmark is a blended composite benchmark that reflects the underlying asset class target allocation to corresponding market index components and is gross of fees. The following market index components were used in the construction of the benchmarks: for U.S. stocks, the MSCI U.S. Broad Market Index; for Non–U.S stocks, the BNY Mellon ADR Index; and for bonds, the Barclays Capital Aggregate Bond Index (formerly the Lehman Aggregate Bond Index). The indexes are unmanaged and do not incur management fees, transaction costs or other expenses associated with managed accounts.