Globally, stocks were flat to down in 2015.
Most fixed income assets were also down modestly.
Sentiment about the wisdom of the Federal Reserve was the main driver of market behavior in 2015. Markets were essentially flat while investors waited on the increase in the Fed Funds rate. The forgettable performance is largely a result of disappointing earnings, mainly due to the collapse in earnings of the energy sector and the strength of the U.S. dollar.
Although asset prices didn’t increase much this year, the purchasing power of our dollars did. In dollar terms, most people’s portfolios are flat to down in 2015. But, the dollar appreciated against the rest of the world currencies by almost 10%. If you are lucky enough to travel to Europe regularly, you’ll notice that the dollar exchange rate is almost 40% more in your favor today than it was in 2011.
Most likely, the dollar will stabilize against foreign currencies in 2015. This eliminates a huge drag on corporate earnings. Assuming that energy prices are near the floor, and that the dollar won’t appreciate substantially in 2015, U.S. corporations should grow earnings about 8-10% over the next year and take stock prices higher.
Turbulence increased due to interest rate uncertainty, oil price volatility, and concerns about the nature of the slowdown in China.
Looking Forward to 2016
New Year’s is a favorite holiday for investment managers. It gives us the opportunity to close the books on the prior year and to look forward to a new year’s limitless possibilities.
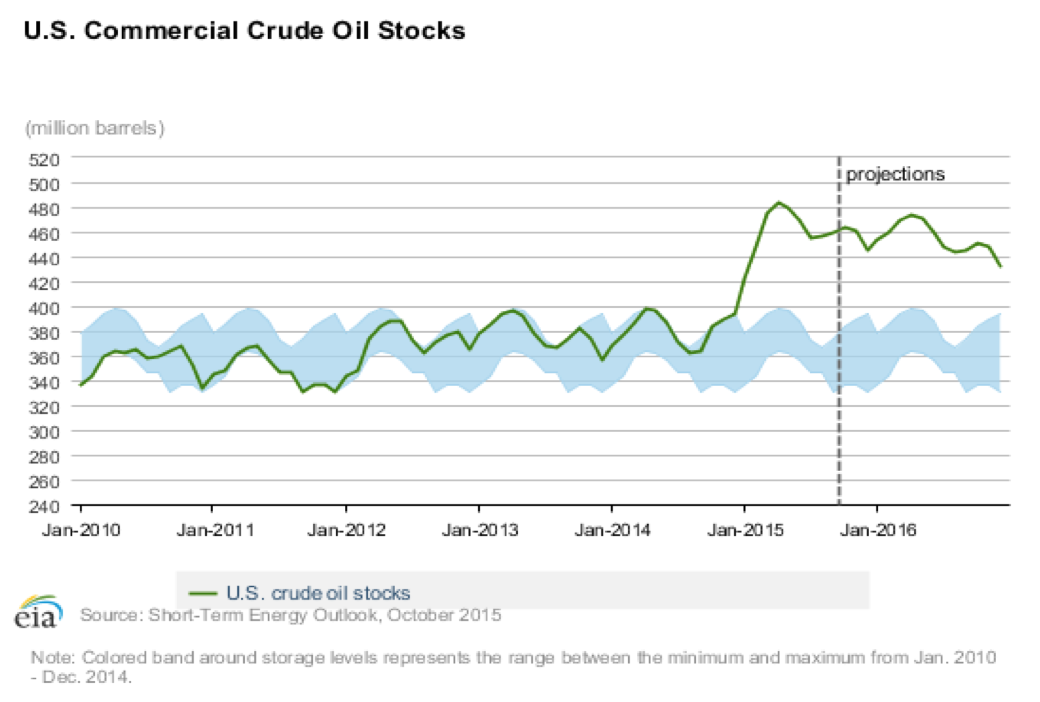
Or maybe not. Global markets fell roughly ten percent in early 2016. Oil is in freefall, trading down to $26 a barrel. Oil and natural gas inventories are far above average, so a rebound is unlikely anytime soon.
Investors are asking, does the recent volatility indicate a more serious crisis on the horizon? Does oil’s drop mean that the global economy will disappoint? I’m not convinced of that. More likely, the price of oil is a result of a huge increase in supply.
The United States, Saudi Arabia, Iran and Libya are producing more oil for the world market than they did years ago. Without a demand increase to offset the supply increase, the price of oil has to fall. Demand for oil is slowing in spite of economic growth. As economies become more energy efficient, the growth rate of oil demand is slower than the growth of the overall economy. I’m fairly confident that the crash in the price of oil is primarily due to an increase in supply of oil combined with weaker demand for fossil fuels.

Declining earnings from the energy sector and a stronger dollar caused disappointing U.S. earnings.
That doesn’t get us out of the weeds though. As oil crashes, there are winners and losers. Oil producing countries like Russia, Brazil, Venezuela, and possibly Canada are facing severe recessions. Japan, India, China and Europe benefit from lower energy costs. In the United States, on balance we benefit from lower energy prices. Heavy equipment and oil services industries suffer, but most consumer households benefit from cheaper energy. All of the industries that use oil or natural gas will see better profit margins as a result of falling energy prices.
China’s slowdown is also unsettling investors. The market is concerned that the slowdown could lead to something more unpredictable, like a currency crisis which would cause the Chinese Yuan to fall. China had been growing as much as ten percent a year. More recently, growth is only five to seven percent. The question is whether the slowdown in growth is part of an orderly transition to a more balanced economy, or a sign that the Chinese government is losing control of the economy.
Major economies typically progress from agrarian, to industrial, to service oriented. The farming economy is the least predictable. Farming economies experience severe booms and busts as supply and demand is very hard to balance consistently. The United States reflected this pattern of growth in the 1800s. Industrial economies are more stable than agrarian economies, but they are still vulnerable to significant shifts in the prices of commodities and interest rates.
The most balanced, stable phase of economic development is when an economy evolves into a service economy. In 1990, manufacturing was the leading employment sector for thirty-six states. Today, manufacturing leads in only seven. The U.S. has become much more service oriented. Health care and business consulting are taking the lead away from energy and manufacturing. This should lead to an economic growth profile that is more subdued, but also much more consistent.
The engines of Chinese economic growth are also becoming more diverse. China is transitioning to a more advanced phase of economic development. China’s growth rate will slow as it transitions from an export oriented economy to a more diversified, consumer oriented economy. This is healthy and predictable.
Rather than suffering through a recession every five years or so, it’s possible that recessions will become much less frequent. If recessions are less frequent, then it is likely that bear markets will also become less frequent. Fewer bear markets means that investors should be willing to pay higher prices for stocks than what they did in the past, when the economy was much more volatile. The global economy will grow more slowly, but the stability of the global economy is improving.
Economies are growing more slowly. It remains to be seen if recessions will occur less frequently. Fewer recessions means fewer bear markets and in theory higher stock valuations.
When volatility hits, the market has a tendency to shoot first and ask questions later. Some of the selling that we’ve seen suggests that some investors are over leveraged to positions that are going against them. When the selling gets most dramatic, margin calls force leveraged investors to sell anything they can, regardless of price.
The investment world is interlinked. Investors in China or the Mideast own substantial positions in S&P 500 companies. Bankers don’t discriminate when they’re forced to liquidate portfolios. The wave of selling continues until it’s exhausted, at which point asset prices revert to their prices prior to the turbulence. We saw this same pattern last summer when the first sign of China’s instability hit the currency markets. This is now the twenty-first drop of more than 5% that we’ve endured since 2009.
China and oil prices will not be sufficient to cause a recession here. There are risks, but if we don’t go into recession, the market should bounce back quickly. As long as the population continues to grow, the market will eventually get back to all-time highs. For long-term investors, the market is always a good buy when it’s lower than an all-time high.
Many investors have concerns that interest rates will move much higher. The Fed only controls a small segment of the fixed income market–the overnight interest rate that banks receive on deposits held at the Fed. The bulk of the bond market was not affected by the rate increase as the move in the Fed funds rate was widely anticipated.
In spite of higher short-term rates (which the Federal Reserve influences), interest rates are generally still very low.
The goal of the Fed Chairwoman is to telegraph Fed moves well in advance so as to minimize the market volatility in response to Fed actions. So far, she has successfully achieved this. The bond market expects two or three more rate hikes in 2016. Any less, and overall interest rates should decline. If the Fed has to increase more than what is anticipated, interest rates will likely increase. If Fed actions match expectations, then I would expect no impact to long-term interest rates.
Interest rates are still extraordinarily low. They will not be an obstacle to higher earnings next year. The market isn’t cheap, but it isn’t expensive either. The fundamentals for economic growth are low interest rates, decreasing unemployment, and an increase in first-time home buyers. If we get a little help from the rest of the world, the economy could perform better than expected. The best years in the stock market tend to come when people least expect them.

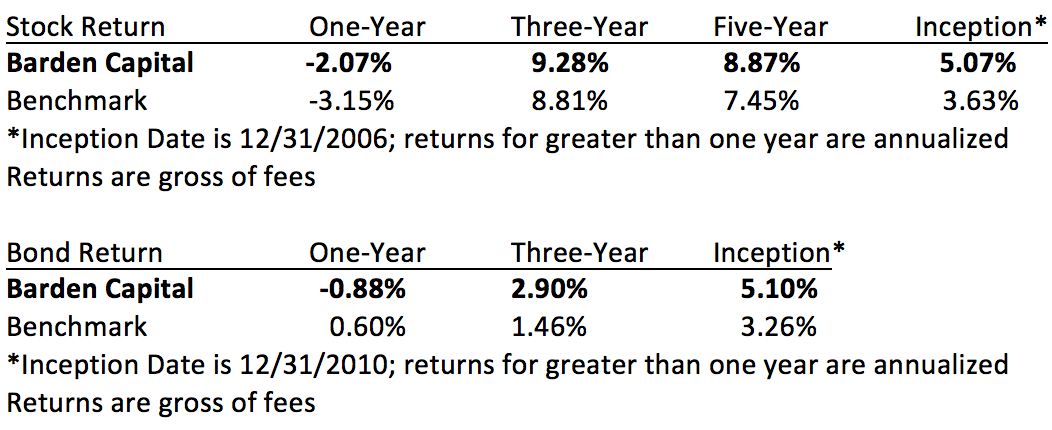
BCM Returns are based on a size-weighted composite of BCM assets under management at the end of the period. The Stock Benchmark is a blended composite benchmark that reflects the underlying asset class target allocation to corresponding market index components and is gross of fees. The following market index components were used in the construction of the benchmarks: for U.S. stocks, the MSCI U.S. Broad Market Index; for Non–U.S stocks, the BNY Mellon ADR Index; and for bonds, the Barclays Capital Aggregate Bond Index (formerly the Lehman Aggregate Bond Index). The indexes are unmanaged and do not incur management fees, transaction costs or other expenses associated with managed accounts.

